Graphing ti ez430 Chronos watch data in Linux
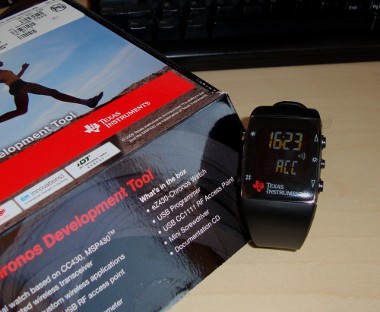
31 Jan 2010Recently my Texas Instruments ez430 Chronos watch arrived, I preordered it the day I read about it on engadget back in November 2009, so it was nice to receive it after all this time. As a dedicated Linux user I found it disappointing that there was little in the way of Linux support provided by TI, however this was not unexpected and a linux application is currently being developed, although progress seems to be somewhat slow. However in the last week breakthroughs have been made, uguryildiz in a post on the TI forum revealed the protocol used to request data from the acceleration sensors and also for setting of the time allowing custom applications to be built using this data on Linux or any other operating system able to use usb serial.
Example code in python was also posted here, basically the protocol for getting the accelerometer data is very simple:
- After connecting the RF USB dongle supplied with the watch and putthe watch into ACC transmit mode and connect to the serial port /dev/ACM0 (on linux) with baud of 115200
- Send the hex string: 0xFF 0x07 0x03 to open a connection with the watch, it should reply 0xFF 0x06 0x03 to confirm a connection has been made
- Accelerometer data can then be requested by sending 0xFF, 0x08, 0x07, 0x00, 0x00, 0x00, 0x00
- The watch will then return seven bytes back in the form ff 06 07 tt xx yy zz where the last three bytes are the accelerometer values.
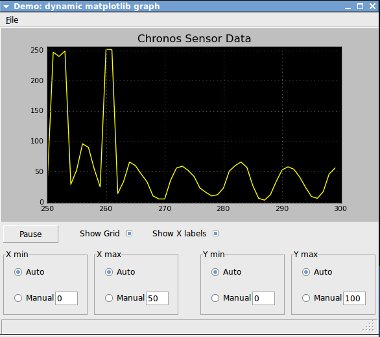
As a simple experiment I used the afore mentioned python code to get data from the watch and then combined this with a graphing gui example kindly posted by Eli Bendersky to make an application which uses matplotlib produce a live graph of the data (currently only one axis at a time).
My code can be downloaded here: chronos_graph.py
It should be noted that this code is very much hacked together, I am not a python coder and have never written anything in python before in my life, but it should work.
I am currently working on trying to get this working with processing and arduino, however serial communication from processing with the watch is proving troublesome so I reverted to python for this example.

