Graphing ti ez430 Chronos watch data in Processing
05 Feb 2010Thanks to a helpful comment on my previous post Graphing ti ez430 Chronos watch data in Linux Sean Brewer posted the help I’d been looking for to get the chronos working with processing.
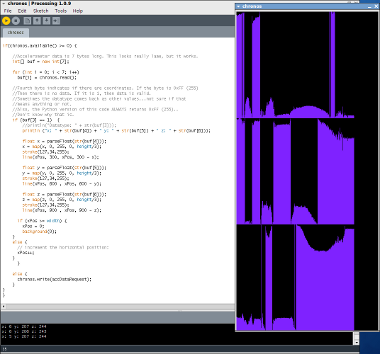
Following on from the sample code posted by Sean (pastebin or my mirror) I have made the code into a more conventional processing style and added simple graphing functionality in processing to allow the simultaneous graphing of xyz data and my updated code can be found below. Using processing seems to perform slightly less well than python as it is slower and less data arrives marked as valid (any thoughts on why this is would be appreciated as always) but still provides a workable system. It does seem to be linked to problems I was having implementing this, where the data appeared jumbled, at that time I wasn’t aware of the validation byte.
Code
chronosgraph.pde - sketch to take data and graph it
chronos.pde - original sketch which just gets data (Sean Brewer)
